We all know traditional histograms:
Well, what would something like this look like when applied to video, and rendered over a linear timeline? Basically, look at the histogram from the top and make it a thin 1pixel by 256pixel strip. Go to frame two, do the same thing, and so on, and so on. The results can actually be very interesting!
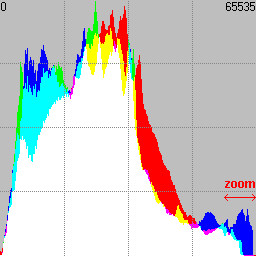
 This is the first 1024 frames of an Unreal speedrun. You can clearly see where the action is, where the player gets hurt, etc.
I'm not sure if this is something that actually HAS a name or not, but I call it a linear histogram. As for any practical application, well, I just find it interesting to look at, especially for highly saturated videos like of speedruns of FPS games. Real world videos aren't nearly as interesting looking, but then again I'm not approaching this from any practical application angle :) but others might.
As for the program I used to render these, it's a c++ application which uses OpenCV 2.3 to video videos. Then it's a simple matter of counting pixel intensities each frame, performing square root and normalization on each channel, and then writing the results to file.
The source code isn't anything too special, it gets the job done, and I'm sure someone who is a lot more technically proficient can make things run a lot more smoothly. I'll post it once my server IP updates again (If you do intend to run it, make sure you have OpenCV 2.3 installed and setup!)
That's all for now!
No comments:
Post a Comment